Visualization is key in making abstract data more understandable, usable and actionable. It helps us to communicate existing information more efficiently and to discover new trends or anomalies from large swaths of data. Visualizations often take advantage of some almost automatic processes in our brains, like noticing red items from a sea of grey; hence, they decrease our cognitive load when interpreting the information. Combined with artificial intelligence we can analyse and present even more complex data in a human friendly manner.
CyberFactory#1 focuses on designing, developing, integrating and demonstrating a set of key enabling capabilities to foster optimization and resilience of the Factories of the Future (FoF). The project consists of 28 partners from seven countries, namely, Canada, Finland, France, Germany, Portugal, Spain, and Turkey.
Our research and development work described here was conducted primarily in the FoF dynamic risk management and resilience work package which comprised of the following four tasks related to the cybersecurity of the FoF that are depicted in the figure below.
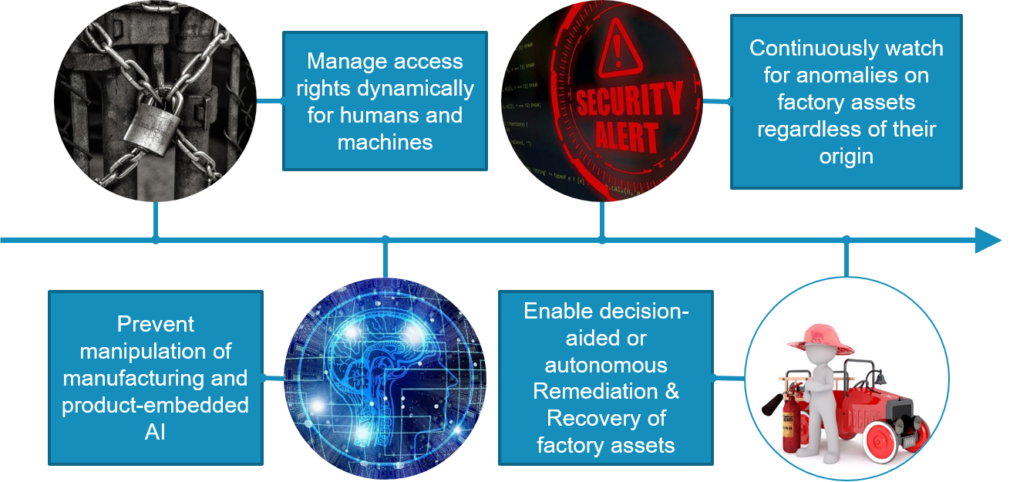
Figure 1. Structure of the FoF dynamic risk management and resilience work package
The collaboration was primarily based on the Human/Machine (H/M) behaviour watch task with the objective of detecting anomalies from the factory floor with the help of sensors, cameras and other monitoring equipment. VTT as the research partner had skills related to cybersecurity, network traffic monitoring and visualisation, while the SME partner, namely Houston Analytics had extensive knowhow about applying Artificial Intelligence and Machine Learning to different business and other sectors. In this particular collaboration effort, Houston Analytics provided analysis on anomalies and VTT tested different visualization options for them.
The Path from Anomaly Data to Detailed Visualizations
The system was based on real world data, consisting of a six-month period of post manufacturing quality measurements data provided by Bittium. The original database contained logged errors and data on quality of defective products. Even though the data was not explicitly designed for machine learning (ML) usage, we could use the data for autonomous learning.
The database was analysed by machine learning algorithms designed by Houston Analytics to detect anomalies. The objective of the analysis was to gain insight on increasing the detection of faults. Furthermore, we wanted to enable predictive maintenance, cut factory downtime and reduce the number of sub-par or rejected products. We used the measurement data to formulate an anomaly score, which enabled the system to report the anomalies that are most likely, and enabled users to see, which elements influenced the score.
The visualization of the dataset became an important tool for making the wide attribute space of the measurement data understandable for humans, with about 50 measurement vectors for each tested unit. The large number of dataset features prevents efficient modelling in human readable form, but using feature vector transformations, we can calculate a top anomaly feature space. This changes the feature space into anomaly space, which in turn is much easier to visualize in fewer dimensions.
Visualizations can be used in two different ways: to convey a known story to an audience in a powerful way, or to discover new information within complicated data. In this use case, we needed to explore different kind of options for visualizing the anomaly data to find new insights. We used open source tools to build the visualizations, namely Python with Pandas and Dash. Pandas is a widely used data analysis and manipulation library, and Dash is a framework for building dashboards or other data apps that are easily used via web browsers. There are plenty of inbuilt options for plotting data with Dash and the web interface includes basic controls for things like zooming or selecting data points.
In the example image below, the user can easily find a couple of anomalous results by their colour. They can then hover the mouse over a particular result to get some identifying information, or zoom in to see the surrounding results in more detail.
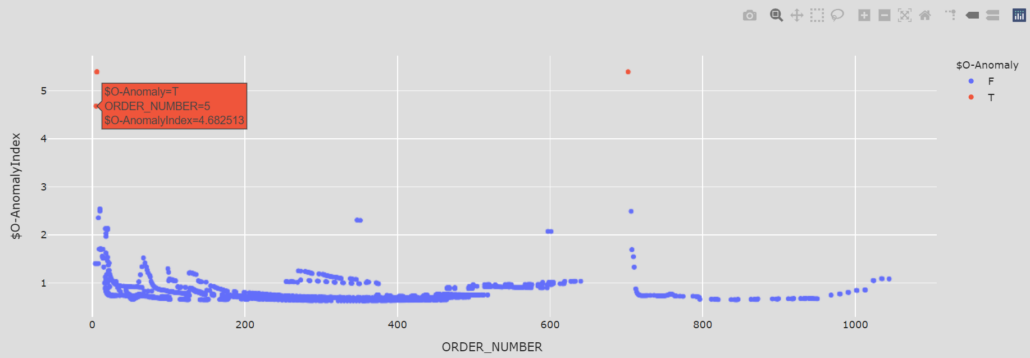
Figure 2. Example of one of the Dash plots used for discovering anomalies in the dataset
Where to Go Next
One of the future research topics related to this development would be the use of AI in other target areas related to the H/M behaviour watch, but without restricting ourselves solely to that topic. One of the CyberFactory#1 research partners from Portugal, ISEP, has already conducted research on the use of AI in human behaviour monitoring on the factory floor, the results of which could be enhanced with the visualization mechanisms used in our work or the analysis capabilities that Houston Analytics possesses.
In conclusion, one of the main themes of the project is to improve the resiliency of FoFs. The data gathered on a factory floor may be very complex and abstract; therefore, we need to process it in order to make it more understandable and actionable to us humans. In this particular case, we first used AI to analyse the data and then applied different visualizations to gain insight on the data.
Acknowledgements
We wish to thank Jari Partanen from Bittium Wireless for providing the measurement data, and Tommi Havukainen and Ville Laitinen from Houston Analytics for creating the anomaly analysis database for use in our research work.
Authors:
Outi-Marja Latvala (research scientist at VTT), Mirko Sailio (research scientist at VTT), and Jarno Salonen (senior scientist at VTT).